WritingA2
4.22 lesson2
动态图 body paragraphs【学习静态数据读取方式/句式/词汇】
Body1 –起始点大小比较(最高级/比较级;静态数据读取方式)
Body2 –趋势变化
本章将以C7 p53为例。

Body1
起始点大小比较(最高级/比较级;静态数据读取方式)
最高级(最多): the highest, the most, the largest, the greatest
比较级: lower/less/fewer/smaller;higher/larger/more
最高级(最少): The least, the smallest, the lowest
表示虚值: About/nearly/almost/approximately/over…/under…
静态数据读取方式:
The consumption of beef was the most about 220 grams.
The consumption of beef was the most, and it was about 220 grams.
The consumption of beef was the most, which was about 220 grams.
The consumption of beef was the most (about 220 grams).
The consumption of beef was the most at about 220 grams.
The consumption of beef occupied(时间空间) most. 这张图不能用占比这个概念
Beef was the most popular meat, with 220 grams beef consumed. with 结构只能用于句子主语是物体本身
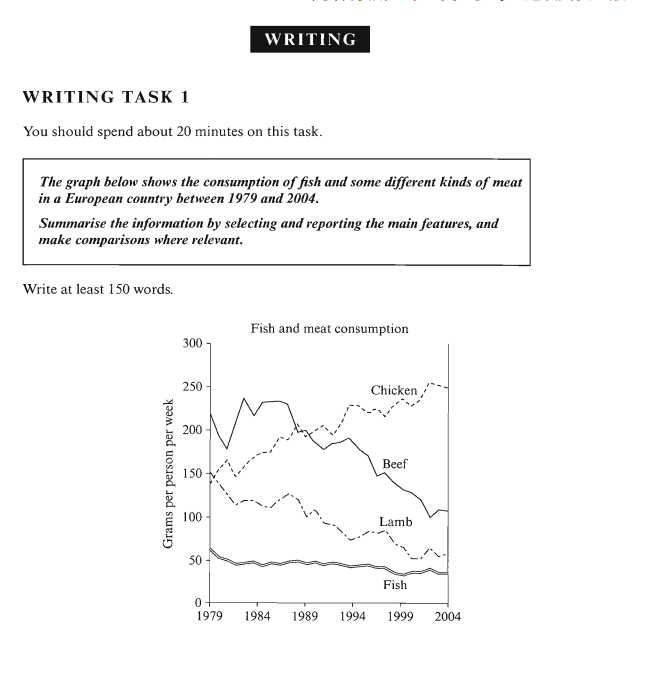
示例: In 1979, the consumption of beef was the most at 220 grams.The consumption of chicken and lamb (around 150 grams) was smaller than the consumption that of beef, while the amount of fish consumed was the least, which was just over 50 grams per person per week.
占比:make up, constitute,account for, represent + %
ps. Girls make up 70% in our class.
*Linking words:*(见class1)
对比关系
相似关系
承接关系
让步关系
Body2
趋势变化句型/词汇/how to select information (终点/拐点/交点)
平稳:
XXX keep/remain + stable/steady at …..(数据) until 2002(over a period of 10 years)
上升/下降
V+adv.
- Increase sharply, climb significantly,grow(grew) substantially, rise(rose) considerably
- Decrease slowly, fall gradually, drop slightly, decline stably/steadily
- XXX increased(v.) sharply(adv.) from 数据 in 1997 to 数据 in 2004.
Adj.+n.
- A sharp increase, a significant climb,
- A substantial growth, a considerable rise
- A slow decrease, a gradual fall, a slight drop, a stable decline
- There was a sharp increase in XXX from 数据 in 1997 to 数据 in 2004.
- XXX experienced/showed a sharp increase from 数据 in 1997 to 数据 in 2004.
上升/下降趋势
上升趋势可以用英语表达为 “upward trend”, “upward trajectory”, “rising trend”, “rising trajectory”, “upswing”等等。例如:
- The sales figures have shown an upward trend over the past few months.
- Our company is on an upward trajectory, with profits increasing steadily.
- The stock market has been experiencing a rising trend in recent weeks.
- The demand for renewable energy is on a rising trajectory due to increasing concerns about climate change.
- The economy is on an upswing, with GDP growth exceeding expectations.
下降趋势可以表达为”tremendous decrease”,”underwent(经受) a downward”, “downward trend”
波动
Fluctuate between (最高值)and(最低值)
Fluctuate around (中间值)
写作技巧
- Arrange your information coherently!(取决于General trend –头尾)
- Use cohesive devices effectively(使用合适的连接词)
连接词的使用
The consumption of beef 剧烈下降 Similarly, the consumption of lamb also 急剧下降.
The consumption of fish also 下降 but 缓慢 On the other hand, The consumption of chicken急剧上升.
The consumption of beef and lamb dropped significantly to about 100 grams and 70 grams respectively over the period, while the amount of fish consumed declined slightly to just under 50 grams in 2004. On the other hand, The consumption of chicken showed an upward trend, rising dramatically to almost 250 grams in 2004.
The consumption of beef and lamb dropped significantly to about 100 grams and 70 grams respectively over the period. The consumption of fish also declined but slightly to just under 50 grams in 2004. On the other hand, the consumption of chicken showed an upward trend, overtaking that of lamb in 1980 and that of beef in 1989. It rose dramatically to almost 250 grams in 2004.
The consumption of beef dropped sharply to about 100 grams and 70 grams,although it rose to its peak at 240 grams in 1982. Similarly, the consumption of lamb dropped significantly to about 70 grams over the period. The consumption of fish also declined but slightly to just under 50 grams in 2004. On the other hand, The consumption of chicken showed an upward trend, rising dramatically to almost 250 grams in 2004.
拐点的描述
承接关系
After the consumption of beef rose from …. to …., this consumption dropped sharply to …..
The consumption of beef rose from …. to …., before this consumption dropped sharply to …..
让步关系
The consumption of beef dropped sharply to …..,although it rose to its peak at 240 grams in 1982.
交点-Overtake (用上升的对象来强调)
The consumption of chicken showed an upward trend, overtaking that of lamb in 1980 and that of beef in 1989. It rose dramatically to almost 250 grams in 2004.
使用比喻或类比的方式表达逐渐增加的趋势。
例如:
- The company’s profits have been like a rocket, soaring into the stratosphere.
- The number of tourists visiting our city has been like a tidal wave, flooding the streets and shops.
- The popularity of the new product has been like a wildfire, spreading rapidly through word-of-mouth and social media.
在表达线性图中一项数值超过另一项时
可以使用以下一些表达方式:
- “Exceed” 或 “Surpass”:表示超过、胜过。
例如:
- In 2022, the sales of our company exceeded/surpassed those of our main competitor.
- The number of tourists visiting our city surpassed our previous record by 10%.
- “Outstrip” 或 “Outpace”:表示超过、远远领先于。
例如:
- The growth rate of our company outstripped/outpaced that of our competitors.
- The new product’s sales outpaced/outstripped our expectations.
- “Overtake”:表示超过、赶超。
例如:
- Our company’s revenue overtook that of our main competitor in 2023.
- The number of users on our platform overtook that of our closest competitor last month.
- “Be ahead of” 或 “Lead”:表示领先、超前。
例如:
- Our company is currently ahead of our competitors in terms of market share.
- Our sales figures have been leading those of our competitors for the past three quarters.
练习

The presented line graph illustrates how much meat was consumed in a particular European country per person per week,from 1979 to 2004 of fish,lamb,beef and chicken.
In 1979 the beef was the most popular meat,the consumption of that was about 220 grams .the consumption of Lamb and Chicken were similar around 150 grams. while the amount of fish consumed was the least, which was just over 50 grams per person per week.
What’s more,during the 25years period the consumption of beef and lamb dropped significantly to about 100 grams and 70 grams respectively. the consumptions of fish was also declined but slightly to just 50 grams.
the consumption of chicken had been like a rocket, soaring into the stratosphere. in 1980 that of lamb exceed that of beef.